
Help using lightpollutionmap.info
www.lightpollutionmap.info is a mapping application
that displays light pollution related content. The primary use was to show VIIRS/DMSP data in a friendly manner, but
over the many years it received also some other interesting light pollution related content like SQM/SQC
measurements, Sky brightness, almost realtime clouds, aurora prediction and IAU observatories
features. If you have a permanent SQM reader installed you can add it to the map by using this form.
If you want a more detailed analysis of radiance (VIIRS/DMSP) changes over a period of time, please use the Lighttrends application.
Send comments about the map, new feature requests and bug reports to Jurij Stare
Data credits:
VIIRS: NASA's VIIRS
SNPP/NOAA-20 Lunar BRDF-Adjusted Nighttime Lights Yearly composites ("AllAngle_Composite_Snow_Free"). Black
marble version 2.0 is used since 06.06.2025. VIIRS overlays 2012-2019 use VNP46A4 dataset, while VIIRS 2020+
overlays use VJ146A4
Aurora 30min & 3-day forecast: NOAA.
Clouds: EUMETSAT, NOAA, MOSDAC/SAC/ISRO and CIRA.
Observatories: Minor Planet
Center (updated: 03.02.2025) and other various sources.
Sky brightness: Created from Black Marble 2.0 product suite (VNP46A4/VJ146A4) provided by the NASA VIIRS Black Marble science team.
World Atlas 2015: Falchi, Fabio; Cinzano, Pierantonio; Duriscoe, Dan; Kyba, Christopher C. M.; Elvidge, Christopher
D.; Baugh, Kimberly; Portnov, Boris; Rybnikova, Nataliya A.; Furgoni, Riccardo (2016): Supplement to: The New World
Atlas of Artificial Night Sky Brightness. GFZ Data Services. http://doi.org/10.5880/GFZ.1.4.2016.001
Falchi F, Cinzano P, Duriscoe D, Kyba CC, Elvidge CD, Baugh K, Portnov BA, Rybnikova NA, Furgoni R. The new world
atlas of artificial night sky brightness. Science Advances. 2016 Jun 1;2(6):e1600377.
SQM data: lightpollutionmap.info users, Unihedron SQM database and GaN-MN
International Dark Sky Places (IDSP): Spinner, Rebecca; Kuechly, Helga; Necsulescu, Diana; Hartley, Ruskin; Scisco, Michael; Kyba, Christopher (2024): Administrative boundaries of selected certified International Dark Sky Places. GFZ Data Services. https://doi.org/10.5880/GFZ.1.4.2024.005 (last update: 30.06.2024).
Elevation data: Produced using Copernicus WorldDEM-30 © DLR e.V. 2010-2014 and © Airbus Defence and Space GmbH 2014-2018 provided under COPERNICUS by the European Union and ESA; all rights reserved.
You can now get lightpollutionmap.info for your mobile device (Google Android / Apple iOS). It has the same features as the web version plus a few additional ones (offline mode, high DPI basemaps, mobile friendlier menus) and has NO advertisements. Because of the latter it comes at a small price (about 5 €).
Left click and drag the map in desired direction or slide your finger if you are using a touchscreen capable device.
Use the mouse scroll wheel (or whatever you have to scroll) to change the zoom or pinch zoom gestures on touch devices. You can also zoom to a desired rectangle by drawing it using shift-left mouse drag. Another way to zoom in is to just double-click/tap the map and it will zoom-in.
The right menu contains controls which you can use to change map contents and view the legend. The menu can be hidden or displayed by clicking on menu button in the top right corner. You can click on the “i“ icon to get additional information about data displayed.
Dark mode option displays the website using a dark theme.
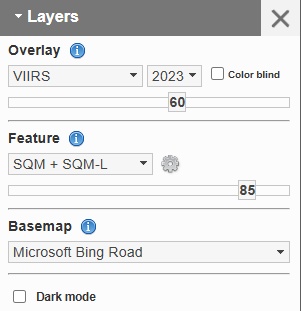
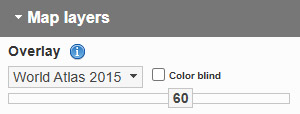
The “Map layers” section of the right menu contains controls which enable you to select a desired overlay, features and base map. Overlay and features have a slider below the selection which you can use to change its opacity. The default opacity is set at 60%.
There are two base layers available, road and satellite.
When you have VIIRS/Sky brightness overlay selected, you can check the "Color blind" option to have the selected overlay displayed in an alternative color style which is color blind friendly.
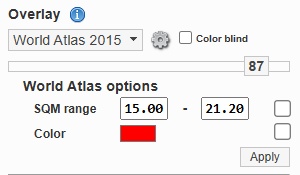
When you have Sky brightness overlay selected, you can Click on the “cog wheel” to display additional options. If you check the checkmark at "SQM range" and click "Apply", only the selected SQM range will be displayed. If you also check the checkmark at "Color" and click "Apply", the selected range will be colored with the color of your chosing. Unchecking both options and clicking "Apply" will return the Sky brightness layer back to the original state.
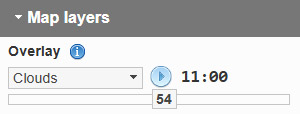
When you have clouds overlay selected, there are two additional controls next to the dropdown menu.
The play icon creates a cloud animation of the last 12h.
Clicking the hour label changes the animation loop speed (it iterates over 4 different speeds, max speed by
default).
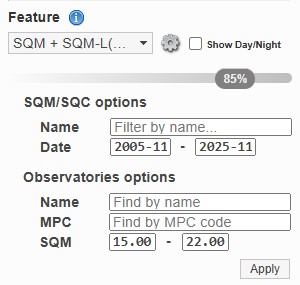
Click on the “cog wheel” to display additional options for the selected feature. You can ie. filter SQM
points by the name (you can enter ie. '*string* OR/AND string') or date. Observatories option contains additional fields used for finding them and assessing
their light pollution levels.
The "Show Day/Night" checkbox enables displaying the day/night terminator on the map. It shows the area
where it is currently night (the darkest area), astronomical twilight, nautical twilight, civil twilight and day light (the 100% transparent area).
The terminator updates automatically every 5 minutes.
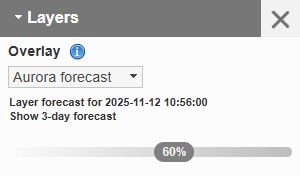
Aurora map shows the 30 min prediction of Aurora visibility. The prediction should be generated every 5 minutes for the next 30 minutes. The date/time of the layer is in UTC
Pressing on the "Show 3-day forcast" will open a window with NOAA 3-day Aurora forecast. The forcast should be updated every day at about 23:10 UTC for the next 3 days.
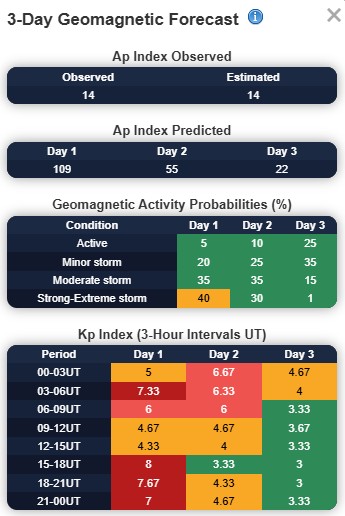
The “Ap index” is a daily-averaged geomagnetic activity metric.
Probabilities for levels of geomagnetic disturbance (Active, Minor Storm, Moderate Storm, Strong-Extreme Storm).
3-hourly forecast of the Kp index (a 3-hourly geomagnetic activity index).
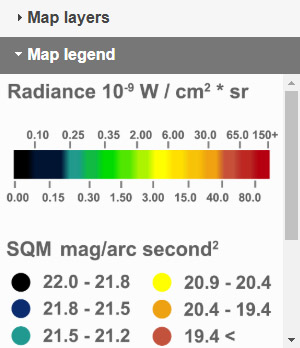
Shows the legend of the currently visible overlay and feature.
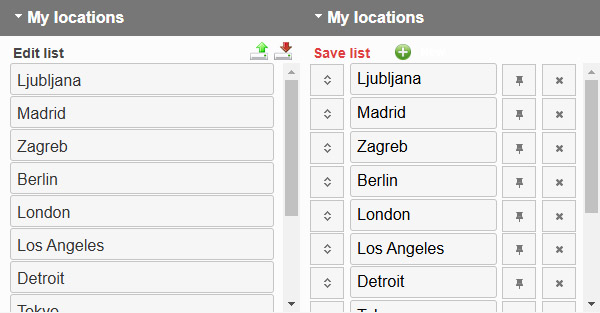
You can create a list of locations to quickly access them later. To start making an entry click on "Edit". When you click on the "New" button (green round + button), a new entry will be created (it creates a snapshot of your current map position). You can name it, reposition it (click & drag far left button up/down) or delete it (far right button). Optionally you can add a pushpin to desired coordinates by clicking the pushpin icon (located between name and delete button), then click on the map. Click "Edit" again to exit the edit mode. The list is only saved on the device where it was created!
You can export the list (.csv format), edit it and then import it back or import it to another device using the upload/download buttons.

Positions the screen where the user is located. The location is provided by a HTML5 Gelocation API using GPS, GeoIP, Cell network or other means.

Measure the distance and azimuth. Left click to start the measurement, double click to end. Azimuth is available if the line is not segmented and it represents the angle from start of the line to the end. Multiple measurements are supported. To clear all measurements, click again on the ruler icon to deactivate it. Clicking on the red X will remove all measurements from the map.

Prints the map to a PNG image.

Left clicking on the map shows a popup displaying clicked coordinates (WGS84 coordinate system in degrees, minutes, seconds format), value of the visible VIIRS overlay and elevation (Copernicus GLO-30 DEM) in meters/feet at clicked location. For Sky brightness there is a bit more information available with an All-sky view option. If no other control is active, this is the default control when left clicking the map unless a feature layer is visible. In such case a feature info is shown first if cliking on a feature point.

Displays statistics of visible VIIRS/Sky brightness layer that intersects the drawn polygon. To draw the polygon use left clicks and double left click to finish. The resulting popup can be moved by grabbing its’ frame and repositioning it. The Raw GeoTIFF button will export the original raw data clipped by the polygon.

Displays statistics of visible VIIRS/Sky brightness layer that intersects the drawn circle. To draw the circle left click, then move mouse and then left click to finish at desired radius. The resulting popup can be moved by grabbing its’ frame and repositioning it. The Raw GeoTIFF button will export the original raw data clipped by the polygon.

Displays statistics of visible VIIRS/Sky brightness layer that intersects the drawn square. To draw the square left click, then move mouse and then left click to finish at desired length. The resulting popup can be moved by grabbing its’ frame and repositioning it. The Raw GeoTIFF button will export the original raw data clipped by the polygon.

Activating this option enables you to add your own SQM (what's an SQM?) measurement to the map.
You can edit the coordinates by clicking on them. This is useful if you already have the precise coordinates written
down and want to use those or just want to see the clicked coordinates.
"Name or location" should contain your name or place name (non-obligatory field).
Local Date/Time field should contain local time (very important!) the measurement was taken. You can either
select the date from calendar applet or enter it manually. Must be in YYYY-MM-DD HH:mm format.
SQM value contains the value.
Make sure you check either SQM or SMQ-L device used.
Comment should contain your comments about the measurement or additional information about the place or weather
conditions (non-obligatory field).
Press submit to submit the form.
If successful, the form will close and show you your added measurement. Make make sure a filter in SQM options is
not active and possibly hiding the added point. Added points cannot be edited or deleted by you, so double check
data you enter.

Activating this option enables you to simulate what happens if an area near a specified observation point changes it's
radiance output.
You are first required to specify the location you wish to simulate ie. an observation point. With a click on the map
a location is marked and a 200km circle in drawn indicating the area which has an impact on the observation point sky brightness.
Next you are required to select an area (inside the 200km circle) by drawing a polygon around it (or a circle or
provide a custom polygon in a WKT format. Geometry type must be "Polygon" or "MultiPolygon"!). It should not take more
than a couple of seconds for the calculation to complete. The calculation uses the currently selected VIIRS overlay
in this window, which you can change anytime!
By moving the slider you modify the contribution of the light sources within the polygon by a percentage and
instantly see the impact it has on the zenith at the observation point. Pressing the All-sky button will show you the simulated all-sky view from the observation point with modified polygon contribution applied.
100% means no change, 50% means a 50% reduction while 500% means a 5 fold increase of the original value.
You can also change the "Simulated Sky Brightness 20XX" value to your target value and all other fields will
recalculate.
The method of calculating the contribution of light sources is described in this paper. Acknowledgements:
Fabio Falchi, Salvador Bará, Raul Lima and Pierantonio Cinzano for providing the suitable PSF.

Using this tool can help you find the closest dark sky location and how far it is.
You are first required to specify a location where you want to start from. There are two optional settings you may
want to modify.
Move the "Minimum site SQM value" slider to set the minimum of a dark sky site. The "Location configuration" is
there to exclude dark sites on small islands or in the middle of a sea.
The tool will try to find the closest pixel in the Sky brightness overlay that matches the criteria and display the aerial distance to it. You can use the "Next" button to find the next candidate for closest dark site. If there is no match, then no such dark site exists within 2000km radius. Optionally you can calculate a route to the dark site or hand it over too Google Maps to calculate the route there.

Displays various moon properties for selected time. It also displays sunrise/sunset and astronomical night start/end times. The widget automatically updates when you move the map or change the time using the time control. The chart displays the moon altitude (and illumination) for the next night.

By left clicking the map it adds a pushpin marker on the map. To remove markers, left click on them.
Markers are added to the URL, so you can send the link over the e-mail and all markers on the map are preserved upon
opening the link.
Clicking on the red X will remove all markers from the map.

Displays the statistics of VIIRS data per country land and territorial waters for each year.
Displays the values of VIIRS or Sky Brightness under mouse pointer. It works at zoom level 8 or above on devices with a mouse.
Located on the upper left corner of the map. Enter a place and by selecting it from a dropdown menu it will reposition the map to it. It is also possible to enter coordinates manually in a “latitude, longitude” format and selecting (or pressing enter) it from a dropdown menu which will zoom to those coordinates.
Located on the bottom left corner of the map. Shows the current map scale. You can toggle between imperial and metric system by clicking on the scale bar.
Located on the bottom right corner of the map. Shows the current coordinates of the mouse cursor or last touch if you are using a touchscreen device. Left click on the coordinate display toggles between decimal and degrees/minutes/seconds display modes.

Located in the upper right corner. Shows or hides the right menu.

Located at bottom of the right menu. A quick way to share the current view of the map. The chainlink icon creates a permanent short link which you can share around. The rest of the social buttons open up social media websites ready to share the map view.

Located on the bottom left corner of the map. Shows attributions associated with visible overlays and base layers.
VIIRS radiance is measured in nanowatts per square centimetre per steradian (nW/cm²/sr). It is a SI radiometry unit for radiance.Here’s what that means:
So, VIIRS radiance tells us how much light energy is coming from a given area of Earth, in a specific direction, as seen from space.
Imagine you're standing outside at night, holding a small detector that can measure light. Now, let's break it down with a simple example:
Example: A Streetlight Seen from Space
So, the measurement (nW/cm²/sr) tells scientists how bright a specific area appears from space, based on the light emitted and reflected from the Earth's surface.
Things get a bit more (actually a lot more) complicated if you want to do a simple conversion to MPSAS. I'm not even going to touch the Bortle scale issue because it is highly subjective scale. Anyway if you are still interested in a "conversion" I can try to explain the problem. Imagine you have a small light source aimed at the sky and this light source gets picked up by the VIIRS detector. The VIIRS detector is monochromatic and has its own spectral response curve. It has no idea of the spectral curve of the light source. MPSAS or more specific magnitude is a measure that is measured in a “specific wavelength or passband”. See the problem? That's one major issue. The other major issue is that light from the light source passes through the atmosphere and while doing this it scatters due to air molecules and aerosols. So you need to create a model of light propagation for the entire Earth taking into the account local air conditions, earth curvature, light absorption, Earth terrain and what not. You can read more about it here.MPC codes are codes assigned by the Minor Planet Center to observatories around the world. They are used to identify the location of an observatory when reporting observations of minor planets, comets, and other celestial objects. The MPC code is a unique identifier for each observatory and is used in the astronomical community to track and report observations accurately. You can find more information about MPC codes on the Minor Planet Center website.
If you want to submit your own or change an existing MPC observatory, you need to contact the Minor Planet Center and the change will be reflected on the map after they update their list. If you don't need a MPC code but just want to add (or modify existing non MPC) your observatory to the map, you do so by clicking on the "Add or modify entries" link located at the top right corner of the Observatory / telescope list page.
At the bottom on the Observatory / telescope list page you can also find the number of pending entries that are waiting for approval. If you have submitted a change and it is not reflected on the list/map and the pending number is 0, then there is probably an issue with the submission and you should contact me.
On 24th of July 2019 I have switched the funding of the website from donations to advertisements.
This was done because donations in the 2019 didn't even cover the server rent costs.
There have been some requests to have an option of not showing advertisements if a donation
was made, so I created an option if you donate you will receive a passkey valid for 3 years, to not see
advertisements (use this form if you lost your key). Please do let me know if
you have not received the key after 12h (check your spam folder just in case). If you recieve a message that you
can't donate, try to send directly to the following PayPal address:
lpmap@t-2.si
Those who use an Adblocker and wish to donate, can also use this link below.
In the last couple of years I have had numerous contributions which helped me with keeeping the site working and
developing new functionalities.
Below is a list of people who made a substantional contribution:
K. Pendoley
H. Bardenhagen
R. Wilson
S. Wallner
First Light Optics Ltd
A. Dainty
R. Hendricks
K. Maruf
T. Wellington
C. Voirol
relay2me, LLC
M. Lockett
J. Wischmann
D. Stavrogiannopoulos
A. Dremali
A. Petrie
A. Tsiotos
J. Opie
L. Tibbals
R. Krcmar
Privacy policy ie. what data is collected and what is done with it can be read here